Monitoring
Monitoring and alerting are used together to give a most complete picture of the
health of a data product. With monitoring, we look at much more information than we consider when
alerting. Monitoring is meant to give a fast, simple overview of the health of the system. How to
best monitor a dlt pipeline will depend on your deployment method.
Run monitoring
Airflow
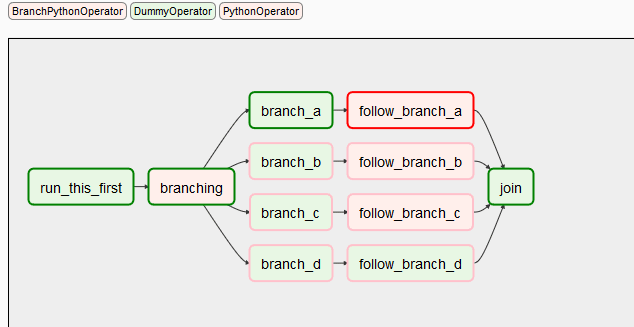
In Airflow, at the top level we can monitor:
- The tasks scheduled to (not) run.
- Run history (e.g. success / failure).
Airflow DAGs:

Airflow DAG tasks:

GitHub Actions
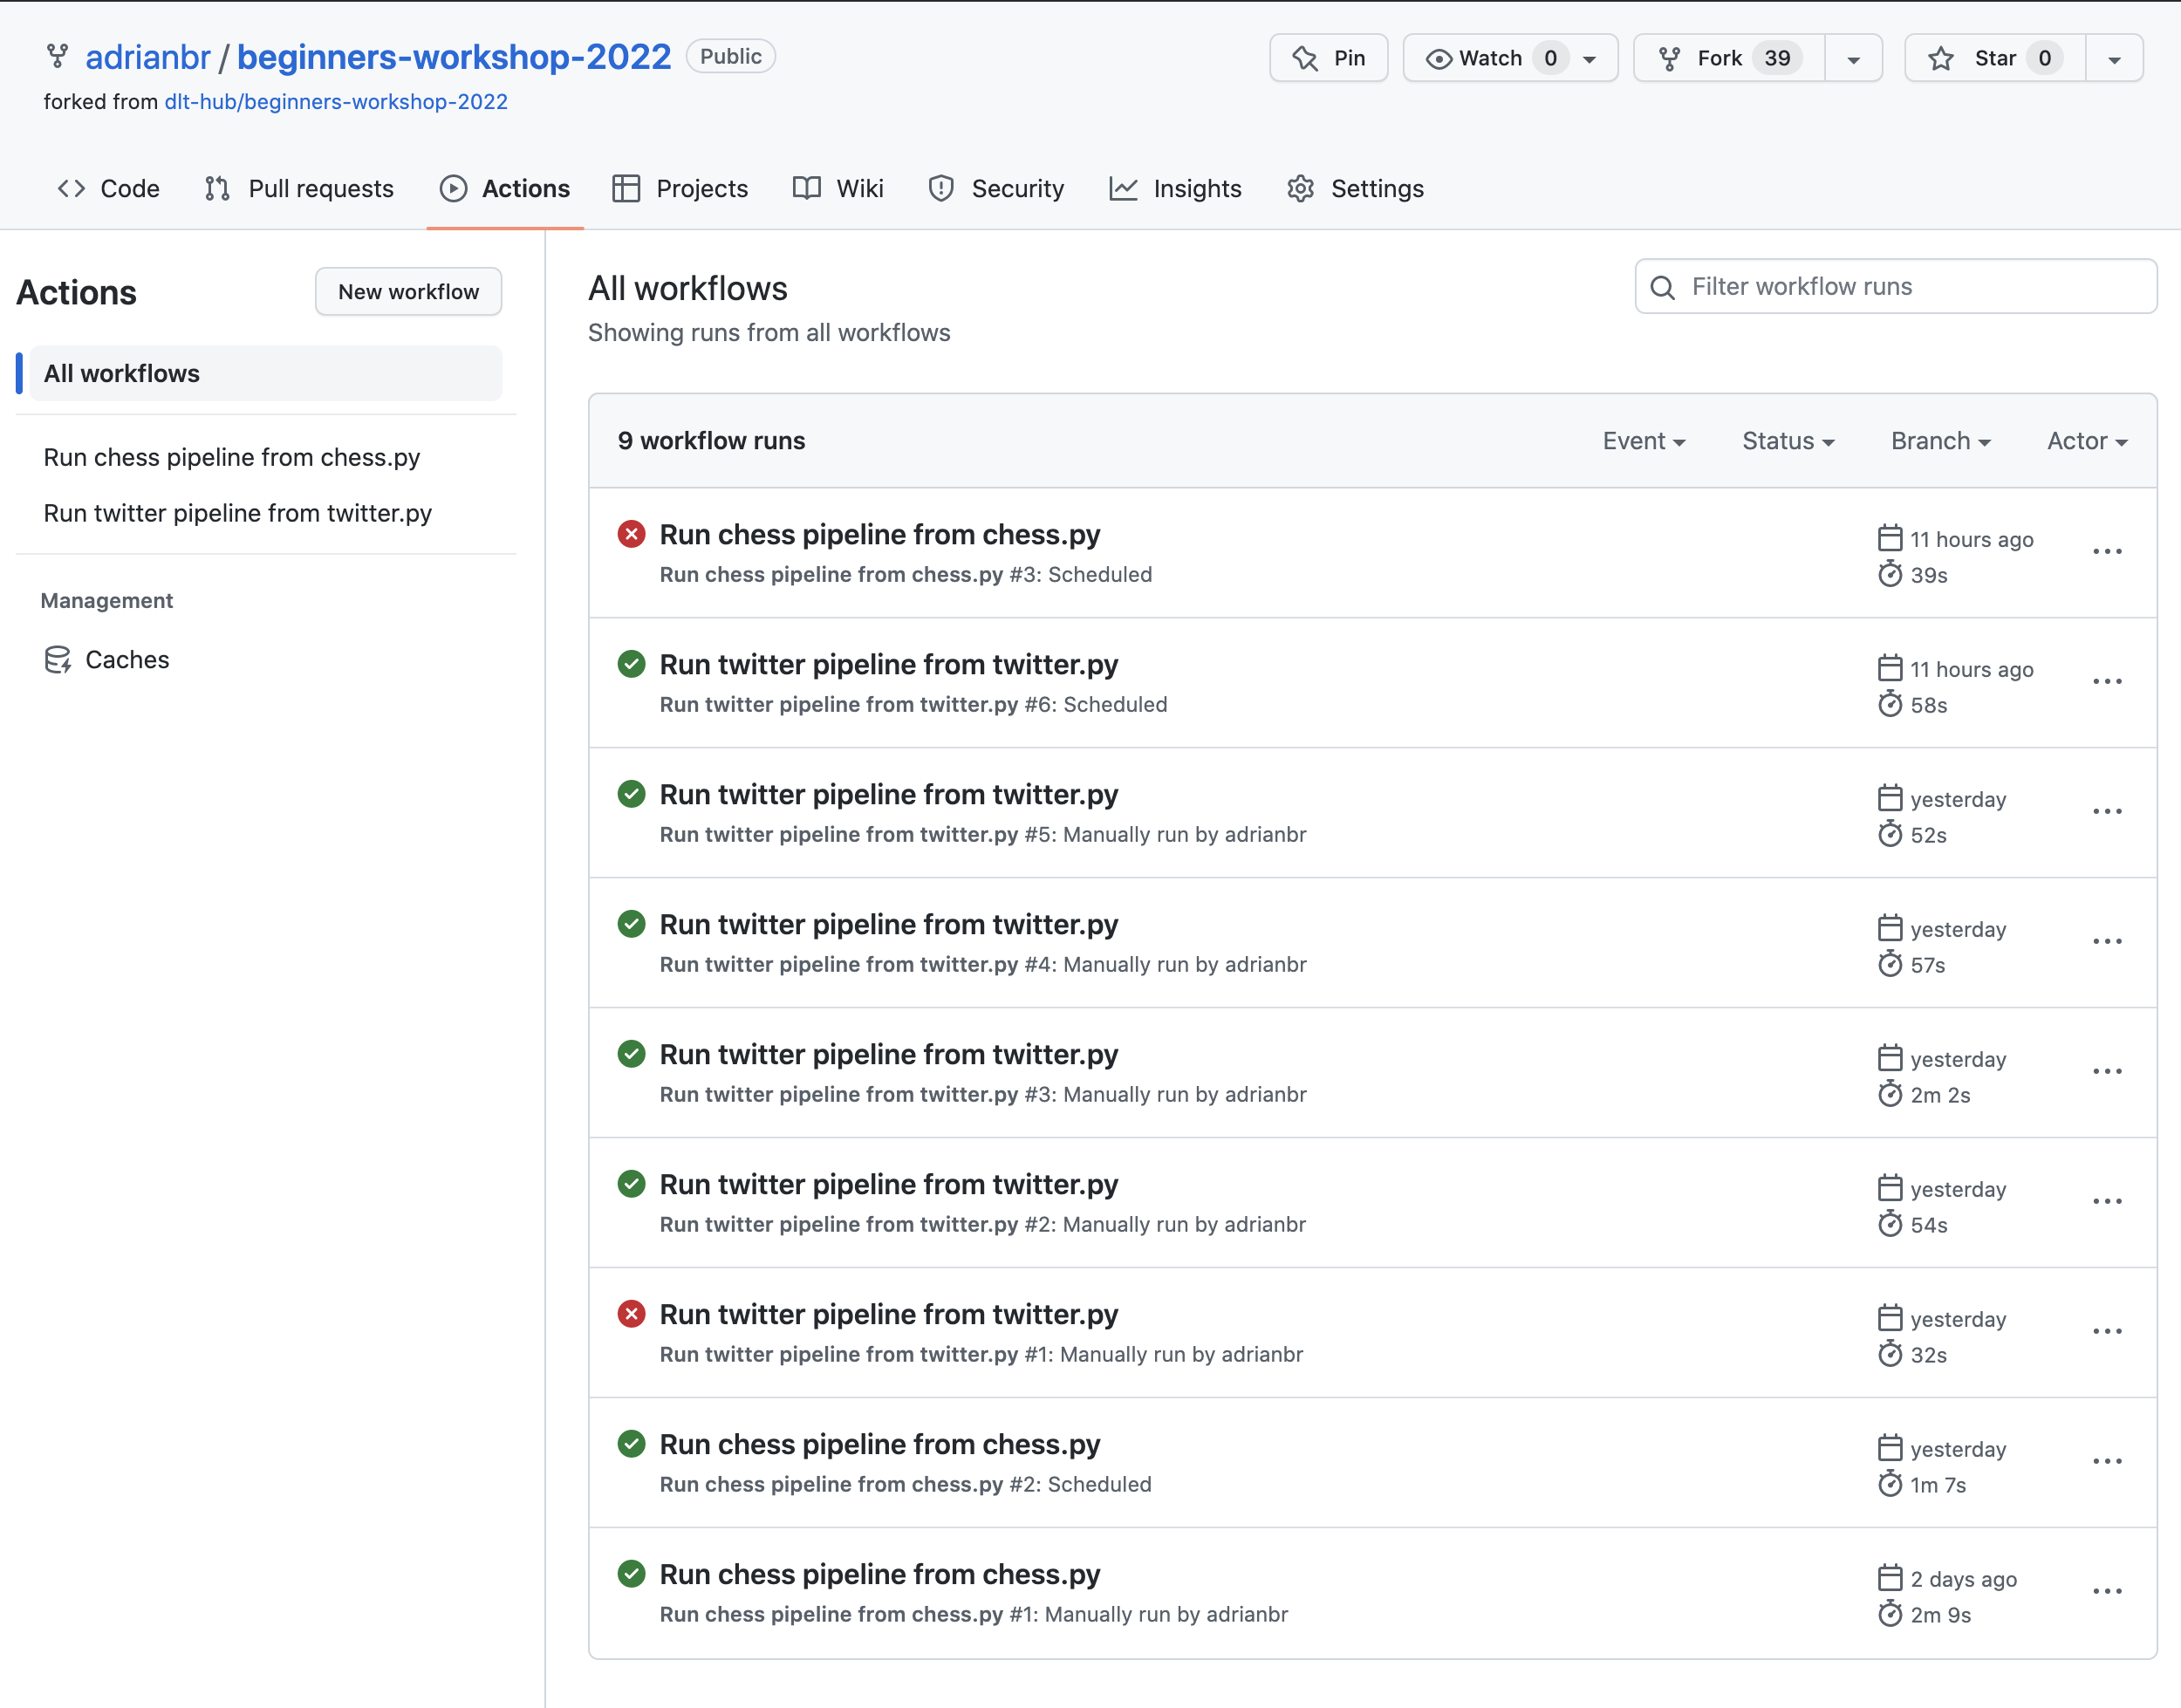
In GitHub Actions, at the top level we can monitor:
- The workflows scheduled to (not) run.
- Run history (e.g. success / failure).
GitHub Actions workflows:

GitHub Actions workflow DAG:

Sentry
Using dlt tracing, you can configure Sentry DSN to start
receiving rich information on executed pipelines, including encountered errors and exceptions.
Data monitoring
Data quality monitoring is considered with ensuring that quality data arrives to the data warehouse on time. The reason we do monitoring instead of alerting for this is because we cannot easily define alerts for what could go wrong.
This is why we want to capture enough context to allow a person to decide if the data looks OK or requires further investigation when monitoring the data quality. A staple of monitoring are line charts and time-series charts that provide a baseline or a pattern that a person can interpret.
For example, to monitor data loading, consider plotting "count of records by loaded_at date/hour",
"created at", "modified at", or other recency markers.